总结摘要
本文档系统介绍了 Go 语言中 pprof 性能分析工具的使用方法,重点分析不同 profiling 工具(goroutine、profile、heap 等)的适用场景,帮助开发者针对性地选择性能分析工具
Go pprof 性能分析工具指南
1. 概述
本文档系统介绍了 Go 语言中 pprof 性能分析工具的使用方法,重点分析不同 profiling 工具(goroutine、profile、heap 等)的适用场景,帮助开发者针对性地选择性能分析工具。
2. 各工具使用场景
2.1 Goroutine 分析
适用场景
- goroutine 泄漏检测:程序运行中 goroutine 数量持续增长不下降
- 阻塞问题排查:怀疑存在 goroutine 阻塞或死锁问题
- 并发模型分析:需要了解程序并发模型和 goroutine 分布情况
- 高并发调优:高并发场景下的性能问题排查
代码示例:
 1
 2
 3
 4
 5
 6
 7
 8
 9
10
11
12
13
14
15
16
17
18
19
20
21
22
23
24
25
26
27
28
29
30
31
32
33
34
35
36
37
38
39
40
41
42
43
44
45
46
47
48
49
50
51
52
53
54
55
56
57
58
59
60
61
62
63
64
65
| package main
import (
"fmt"
"net/http"
_ "net/http/pprof"
"sync"
"time"
)
func main() {
// 启动 pprof 服务
go func() {
fmt.Println("pprof 服务地址: http://localhost:6060/debug/pprof")
http.ListenAndServe("localhost:6060", nil)
}()
// 场景1: channel 接收阻塞
ch1 := make(chan int)
go func() {
fmt.Println("channel 阻塞 goroutine 启动")
<-ch1 // 永久阻塞
}()
go func() {
time.Sleep(2 * time.Minute)
fmt.Println("2分钟后解除 channel 阻塞")
ch1 <- 1
}()
// 场景2: select 多路等待
go func() {
ch1 := make(chan int)
ch2 := make(chan int)
fmt.Println("select 多路等待 goroutine 启动")
select {
case <-ch1:
case <-ch2:
}
}()
// 场景3: 锁竞争
go func() {
var mu sync.Mutex
mu.Lock() // 获取锁
go func() {
time.Sleep(time.Minute)
fmt.Println("1分钟后解锁")
mu.Unlock()
}()
fmt.Println("锁竞争 goroutine 启动")
mu.Lock() // 再次获取锁导致阻塞
}()
fmt.Println("程序运行中,查看 goroutine 状态方法:")
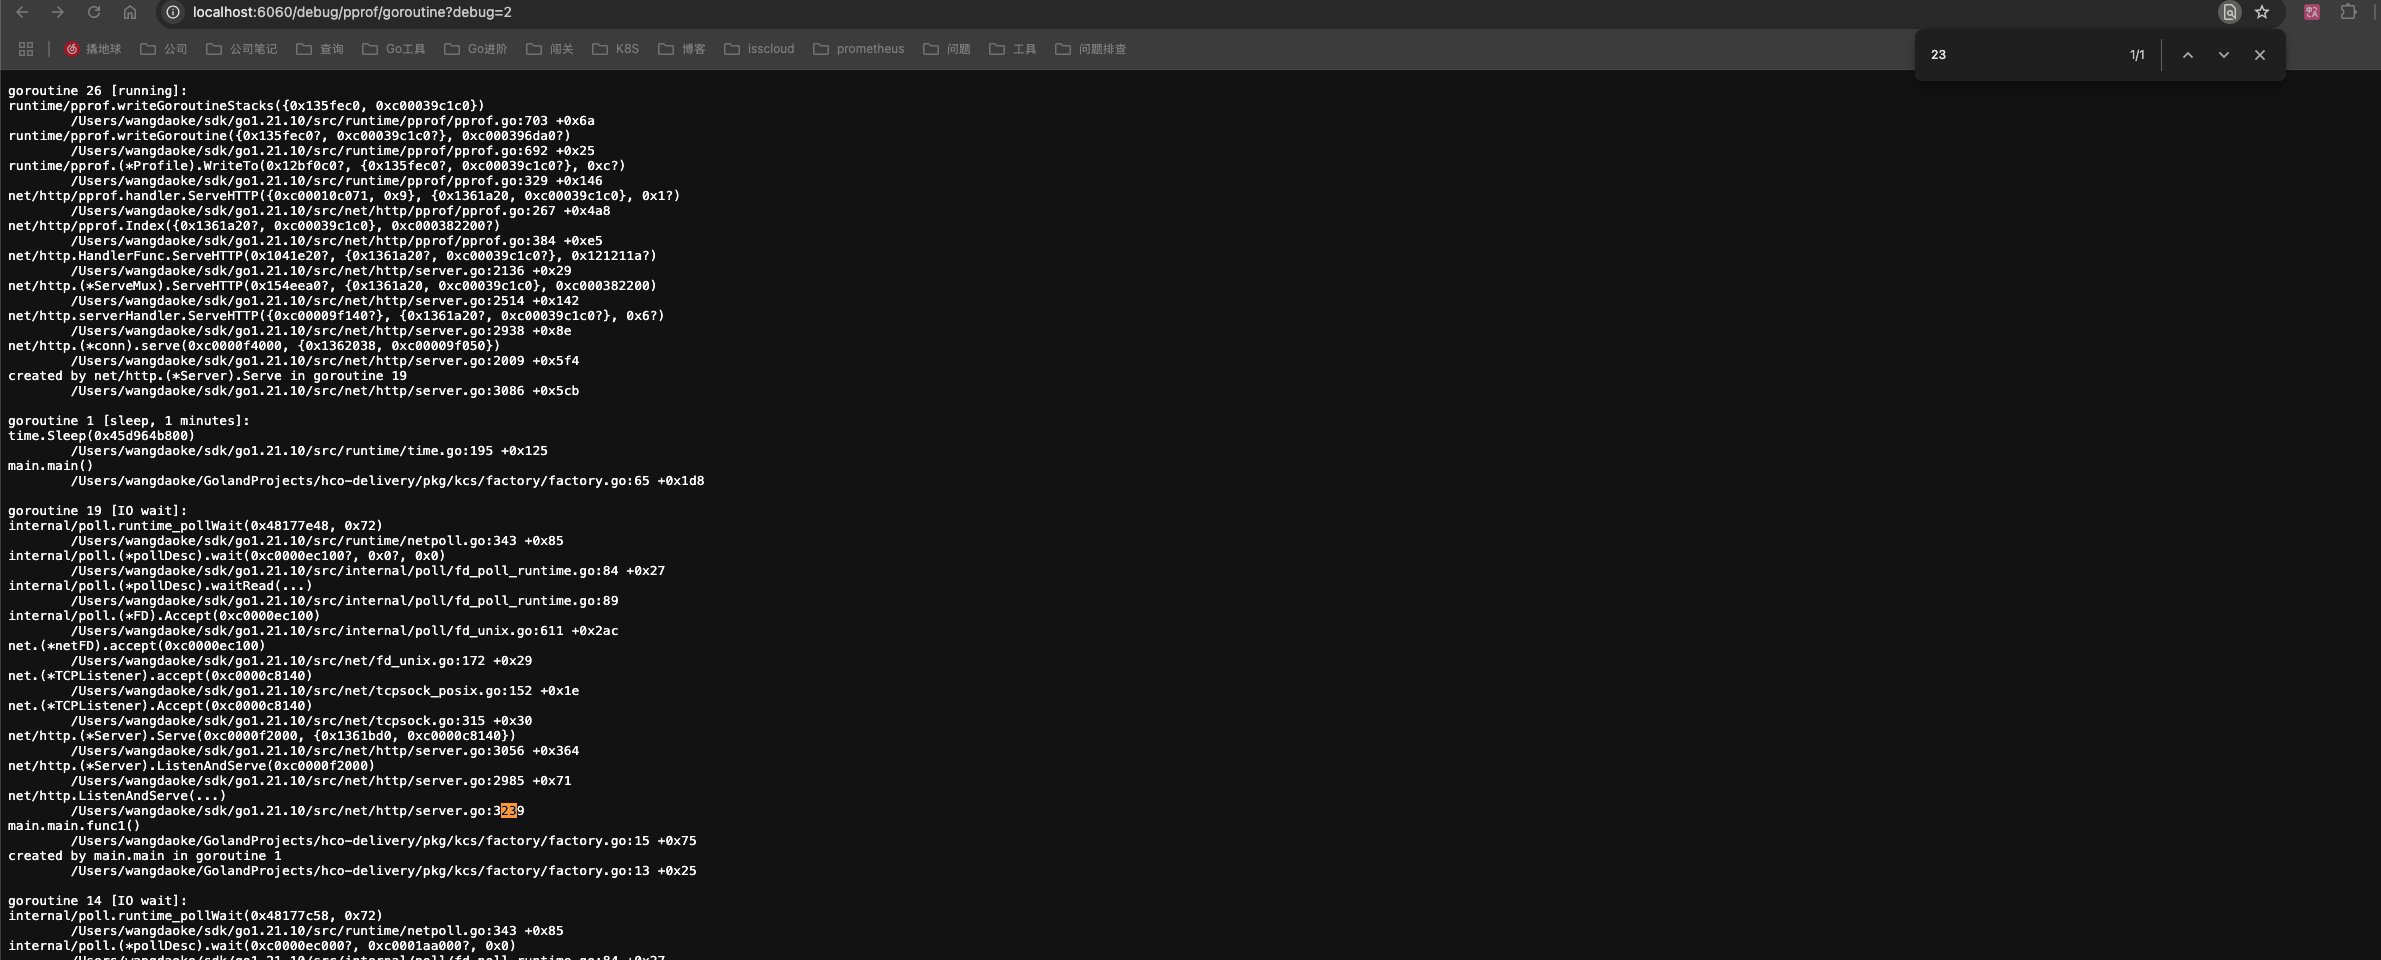
fmt.Println("1. 浏览器访问: http://localhost:6060/debug/pprof/goroutine?debug=1")
fmt.Println("2. 命令行: go tool pprof http://localhost:6060/debug/pprof/goroutine")
fmt.Println("程序将在 5 分钟后退出...")
time.Sleep(5 * time.Minute)
fmt.Println("程序退出")
}
|
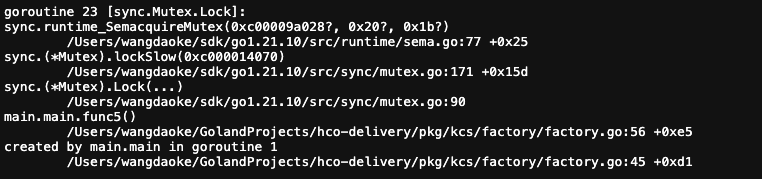
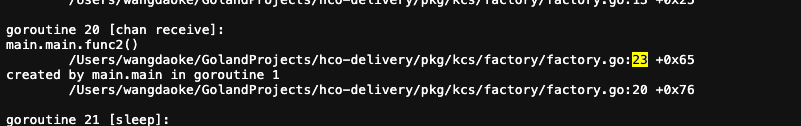
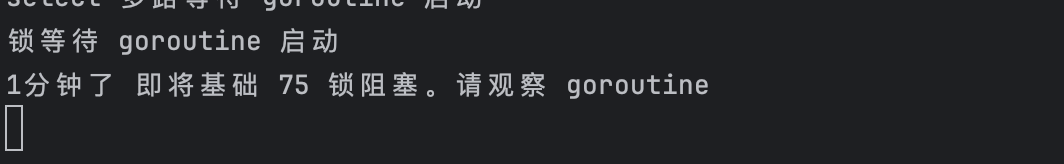
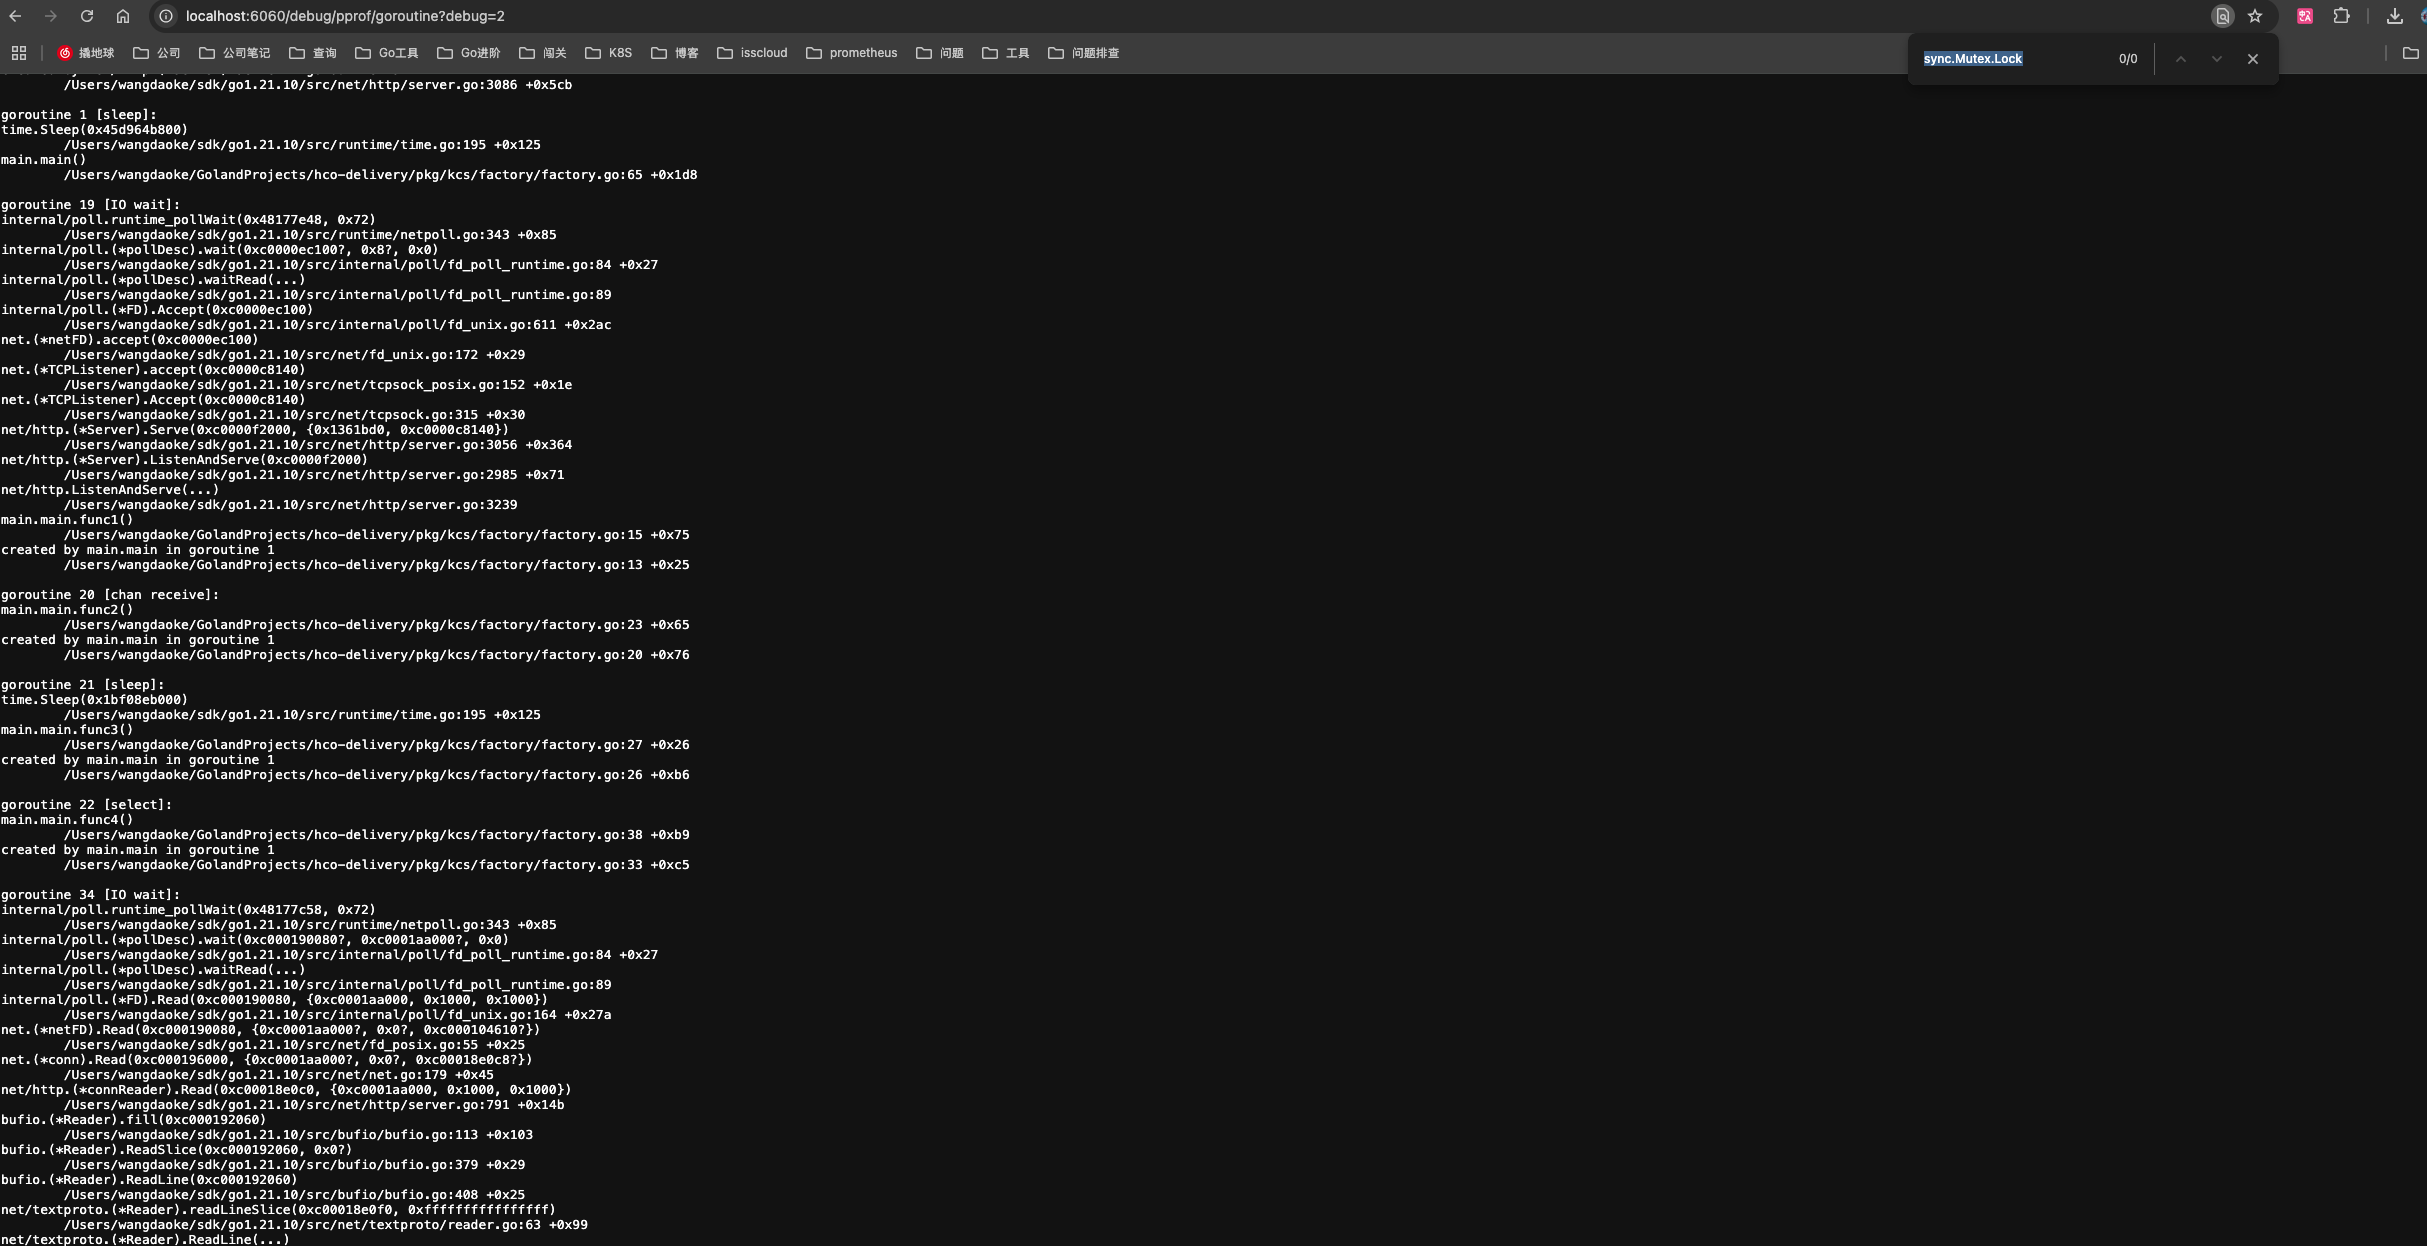
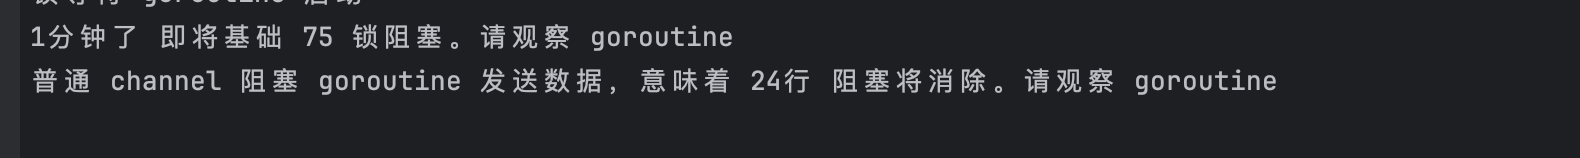
运行观察:
数据采集方式
通过 HTTP 接口采集
以下两种方案均可:
- go tool pprof -http=:8080 http://localhost:6060/debug/goroutine
- http://localhost:6060/debug/pprof/goroutine
通过程序运行时采集
import _ “net/http/pprof”
持续更新……